Efficient Distributed SpatioTemporal Datastores for Smart Cities by Michael Wilbur
1. Problem Context
With the proliferation of affordable sensor and networking units, technologies of the past are entering the connected world at a rapid pace. The roads, buildings and appliances we rely on everyday are now generating large scale data at a frantic pace. Within this data lies insight to our interaction with the physical world around us only now conceivable.
How do we use this data to ultimately improve the quality of life of citizens and enhance our interactions with our urban environment? Continuing the rate at which devices are connected is surely important, as is the data mining and AI algorithms used to comprehend this data. However, data collection and processing is only as good as the methods by which we store and access this data. As the velocity, volume and variety of this data explodes the data store architectures and methods we deploy are the fundamental center of the future smart city.
Suppose a special event is to take place in a dense region of the city. The event expects many thousands (in the case of the NFL draft… hundreds of thousands) of people to flood an area over a couple of days. To prepare for such an event, the analytics team needs to efficiently aggregate historical data to provide a view of normal operating behavior of the region within a bounding shape (ie a polygon). Additionally, city officials want real-time monitoring and visualization application to monitor the data as the event unfolds. Now latency is our primary concern.
Now suppose we are looking to optimize energy demands in our public transit system or optimal routing in a disaster scenario. These applications require searching by bus route, surrounding traffic conditions and weather.
As each data source maintains its own data schema, smart city data is highly unstructured and irregular. Some applications are latency sensitive, while others require heavy batch processing and static data sets. In this way, client applications are closely integrated with the data structures in which the data is stored. For this reason we outline a modular smart city data architecture centered around a distributed log in which structured data views (SQL, Document, Graph) can seamlessly connect and sync with historical and real time data as needed.
2. Understanding the problem
While software infrastructure has long existed for shared computing and networking (Unix/Linux and TCP/IP), no such systems exist for storage resources. The explosive growth in the volume and velocity of data generation in nearly every field of research has made problems of data logistics (i.e. “ensuring that data [are] in the right place at the right time and accessible by the right users”, Chard et al.) increasingly intractable. The disparate nature of existing data stores and the query languages to access these stores presents unique problems for researchers tasked with sharing large scale spatiotemporal data between colleagues in a timely way.
In addition to the problem of having the right data available at the right place the researchers in the urban science initiatives have to also deal with the inefficiencies of querying and operating on the high volume and high velocity geospatial data. Location-aware data is a critical component transportation, shipping and retail analytics. Google alone generates about 25 PB of data per day, a significant portion of which is spatiotemporal (Jiang et al.). With the advancement of mobile technologies, the volume and velocity of spatiotemporal data poses a unique challenge to data storage and efficient querying of this data.
The fundamental challenges related to distributed spatiotemporal datastores we plan to address are as follows:
-
Handling high velocity/volume spatiotemporal data efficiently and quickly.
-
Allow for real-time access to data for researchers and various applications, as well as easy transfer of aggregate datasets for batch processing.
-
Consistency - provide a mechanism for strongly consistent, reliable storage of incoming data sources.
-
Handling unrelated and challenging schemas. By centering our system around a persistent distributed log structure, optimal data stores can come and go as needed - providing high extensibility for the smart city data of the future.
-
Interaction between static spatial data (such as elevation, OSM etc.) and real time temporal data.
Lets look at an example focused on public transit bus routing. Table 1 breaks down two separate sets of queries a public transit bus application may need. First we may need to find all vehicles within a region. Most databases with spatial extensions can handle this query within a polygon use case - including document stores and specialized spatial databases such as ESRI or PostGIS. Case two is an application that wants to identify bottlenecks along bus routes. This is more complicated, as we need to combine data from multiple data sources with various schemas. At this point there are two options:
-
Store all data in one data structure. This data structure handles all queries. This is most common in practice. Typically a document or SQL based store with geospatial indexing is chosen for this task.
-
We could maintain a spatially indexed data view as well as a graph based view. This means we can direct queries depending on the optimal data view for the task.
Query 2 represents a case where we need to query highly connected routing information (in which a graph structure is optimal) while also needing aggregate queries in which spatially indexed document or SQL stores are best. The traditional approach as described in approach one struggles to efficiently store these highly differing data schemas. Given the high variety of incoming data schemas, extensibility of the data views is to be a critical component of smart city data architectures.
| Goal | Data Sources Needed | Queries Needed | Optimal Data Structures |
|---|---|---|---|
| All buses in a region. | - bus locations - bus route | - buses within polygon - aggregation across time | - spatial indexed data store (document, ESRI etc.) |
| Identify bottlenecks on bus routes. | - bus route - bus speed - surrounding traffic - road network infrastructure | - road network shape along route. - traffic per road segment - bus route ID - bus speed - weather | - graph data store - spatial indexed data store (document, ESRI etc.) |
Table 1: Example queries related to public transit bus systems.
3. Current State of the Art
Existing data stores have the ability to aggregate values along spatial and/or temporal dimensions using indexing structures such as B-tree, R-tree, KD tree etc. In this context, geo-data types typically consist of single point values or trajectory paths that are composed of paths of geo-points. Modern databases including Oracle, MongoDB, Redis, Couchbase and Neo4J provide geo datastores. Additionally, the difficulty in storing geospatial data has given rise to specialized databases including Esri and PostGIS that are centered around storing and querying geo-data quickly and efficiently. To incorporate temporal dimensions these data stores use time stamps associated with each data value.
Whether using spatial indexing in general purpose databases such as Oracle, MongoDB ect or working with a specialized geospatial data store such as Esri and PostGIS there are three primary problems developers face. First, the variety of approaches tends to result in ad-hoc solutions in which geospatial storage is tacked on to existing data stores not optimized for working with such data. Second, it ignores the high variability of data sources and data schemas associated with a full smart city data infrastructure implementation. As schemas from different data sources are often unrelated and challenging to work with, fitting them into a single type of index or data model makes efficient access to such data challenging. Lastly, while these storage models are effective for aggregating values along spatial and/or temporal dimensions, they fail to capture the correlations between spatial and temporal dimensions. Spatiotemporal analytics in particular require a fine-grained understanding of these correlations to build accurate predictive models. Additionally real time predictions require efficient querying of such data. These queries often require searching for similar scenarios based on complex spatio-temporal correlations at a granular level existing approaches fail to address.
Studies on actual implementation of such systems for smart cities are limited. Abaker et. al. (2016) outlined the importance of big data in smart cities and speculated that NoSQL databases would be the primary data store for such systems. Kaur et al (2019) provided an empirical discussion of various NoSQL databases for high volume/velocity traffic data and by process of comparison determined document data stores such as MongoDB and CouchDB were the preferred data store mechanism for these types of data. Cheng et. al. (2015) detailed a smart city data and analytics platform called CiDAP. Their system was centered around CouchDB and included customly built IoT-broker and application facing Server for data access. Additionally the system included an optional data processing component based on HDFS and SPARK. Their analysis included implementation of the system and a discussion of performance for varying velocities of incoming data.
4. Our Solution
4.1. Distributed Ledger
Modern smart cities present a high variety of data structures and sources. This includes well known formats such as Mobility Data Specification (MDS) for dockless e-scooters and bicycles, GTFS for public transit as well as vendor specific formats such as ViriCiti monitoring of bus transport vehicles. The high variation in data structures presented makes a unified schema for all data sources impossible. However, all data sources have two shared dimensions: time and space. In terms of time, each event regardless of data source is typically timestamped representing a single point in time at which point that event occurred.
A distributed log/ledger provides an append only data structure in which new events are added to the ledger as data streams into the system. The append only structure of distributed ledgers naturally mimics the temporal nature of incoming smart city data, making it “real-time data’s unifying abstraction” (Kreps 2013). By storing highly various data in this fashion, users can obtain data quickly and efficiently across the unified dimension of time which is ideal for both real-time applications as well as historical analysis for a given time range.
The governing principle of the distributed ledger is immutable facts. These immutable facts provide the source of truth from which all other data stores are derived. The immutable nature of the distributed log provides strong consistency and replication at the heart of the spatiotemporal data store architecture. By providing hierarchical ledgers and locating them in different geographies we can provide access to real-time streaming data and the structured views (Section 4.3) can be used for analytical queries that can sustain latency.
In addition to highly variable data structures presented, the method by which the data is obtained, whether through REST APIs, websockets ect, is source dependent. As the distributed ledger is the primary data store for incoming smart city data, a consistent interface and well known transport methods are required. This is important so that developer time spent on implementing new data sources does not become a bottleneck as the overall data storage architecture is expanded and new applications are built.
4.2 Distributed Ledger Implementation
We implemented the distributed ledger using Apache Pulsar (Pulsar 2.4.0). Apache Pulsar is described as the “next-generation pub/sub messaging system” and was developed at Yahoo (Merli, Ramasamy 2019). In contrast to similar messaging systems, such as Apache Kafka, Pulsar uses Apache BookKeeper to implement the ledger in a distributed manner. This is important as in many smart city applications the volume/velocity of incoming data is highly variable between data sources. While systems such as Kafka implement a data store per topic, the distributed nature of BookKeeper provides a more efficient mechanism for storage in the ledger.
A second critical aspect of Apache Pulsar is that the processing demands required from brokers is separated from the storage demands of the distributed ledger. By separating these two concerns, the system can be easily scaled in terms of processing and/or storage separately. This means as demands of the system change, additional processing and/or storage can be added as needed (Fig. 1).
Lastly, Apache Pulsar provides a variety of well known APIs for data processing and access. As in our system Apache Pulsar is both a data processing/steaming tool, as well as the immutable source of truth from which other systems are derived, we focus on two of the available workflows in Pulsar. First is the Producer/Reader workflow as shown in Fig 2. This workflow resembles the traditional smart client - dumb broker architecture used in other ledger based systems such as Kafka. In this architecture the clients are required to remember where they are in the ledger and read data accordingly. This is especially useful for new client applications that need to catch up to the current point in time, in which case they can select a previous point in time and read all data before getting to the new point in time. This makes it very easy to add, remove or update new client applications or derived storage systems as needed.
Secondly, we use the Source/Function/Sink architecture as shown in Fig
- In this architecture Pulsar itself handles connections to client applications and derived data stores, in effect creating a smart broker and dumb client architecture. For what this architecture loses in flexibility (compared to Producer/Reader), it gains in reliability. This reliability stems from incorporating the business logic within Pulsar itself where each component is managed by Pulsar’s ZooKeeper. This makes it ideal for connecting to derived data stores such as MongoDB, PostgreSQL or Neo4J.
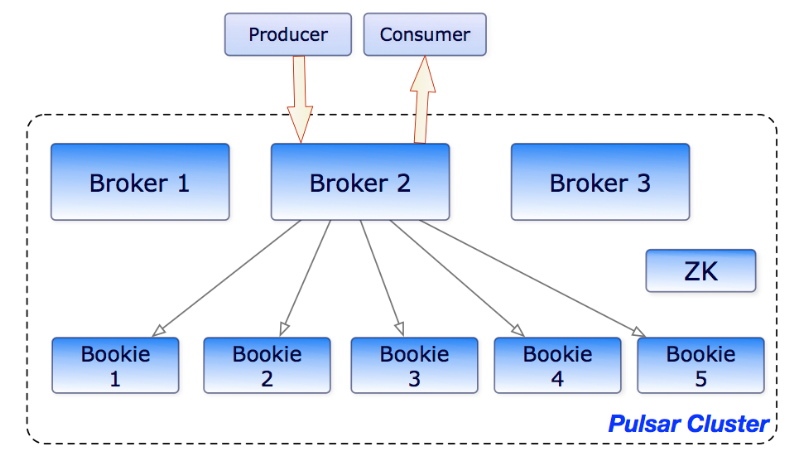
Fig 1: This shows the separation of brokers and bookies (Apache BookKeeper nodes) in Apache Pulsar. By separating processing (ie the Brokers) from the storage units (ie the Bookies), the system can be scaled separately in terms of processing and storage. In this case, if additional processing is needed, additional brokers are added while if additional storage is needed, additional bookies are added. The entire system is maintained by Apache ZooKeeper. (Ref. Apache Pulsar Documentation).
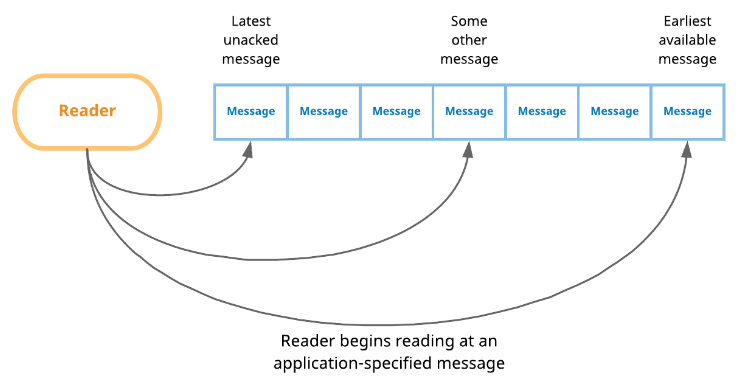
Fig 2: This shows the Pulsar reader interface. The reader interface is ideal for adding or updating new client applications by providing easy and customizable access to the distributed ledger. In this way new clients are customized according to the requirements of the new client, providing excellent flexibility in new client design.
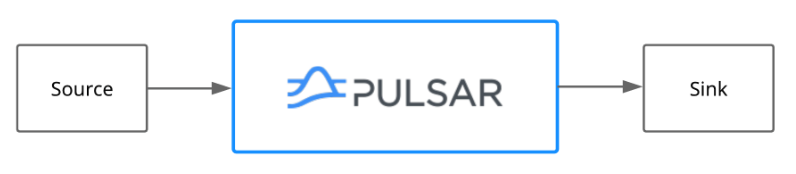
Fig 3: Source sink architecture. This architecture mimics the traditional smart broker - dumb client architecture. By letting Pulsar’s ZooKeeper manage the business logic associated with data sources, this architecture provides enhanced reliability making it ideal for connecting to derived data stores such as MongoDB, PostgreSQL or Neo4J.
Summary of distributed ledger - Pulsar implementation contributions:
-
Distributed ledger provides efficient real time access to data and querying along temporal dimension.
-
The distributed ledger also provides strong consistency by building a log of immutable facts. These immutable facts act as the source of truth from which all other data stores are derived.
-
Source/Function/Sink, Producer/Consumer provide two workflows that allow easy implementation of complex new data sources into smart city architecture.
-
The separation of processing and storage in Pulsar allows for easy scaling, creating a dynamic system to handle the high velocity/volume required by current smart city data architectures.
-
Security - access to data is granted at the tenant level, allowing multiple topics to be grouped into security groups as needed.
4.3 Derived Structured Data Views
Structured data views are derived from the distributed ledger and can be used for analytical queries that can sustain latency. As previously discussed, the distributed ledger is an ideal data structure for representing the shared time dimension across the various data sources. The structured data views provide access to the second shared dimension space. For this our prototype architecture has a document based structured view (MongoDB), and a graph based structured view (Neo4J).
Our MongoDB view represents space through R-Tree geospatial indexing, a common spatial representation used in specialized geo datastores such as Esri and PostGIS as well as general purpose data stores such as PostgreSQL. This data view is highly efficient for aggregate spatiotemporal queries that can sustain latency. A common use case of this view is sharing data between colleagues as well as batch processing and analytics.
The graph view provides an efficient data structure for highly related spatial data and is provided for complex traversal queries, such as routing, of the data by storing geospatial network data. To provide consistency on the data we plan to use Open Street Map (OSM) data to generate a transportation routing network stored in the Neo4J and then tie the urban data to the network as shown in figure 4.
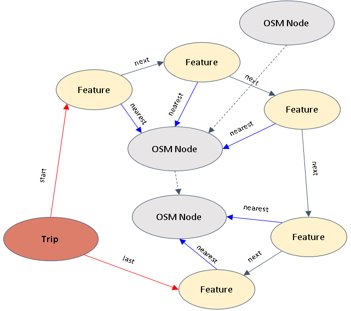
Fig 4: Spatial representation of data using a graph structure. Here we map incoming data (in this case dockless scooter trips) to an underlying OpenStreetMap graph. This data view provides an optimal structure for representing highly related geospatial data and is used for complex traversal queries, such as routing.
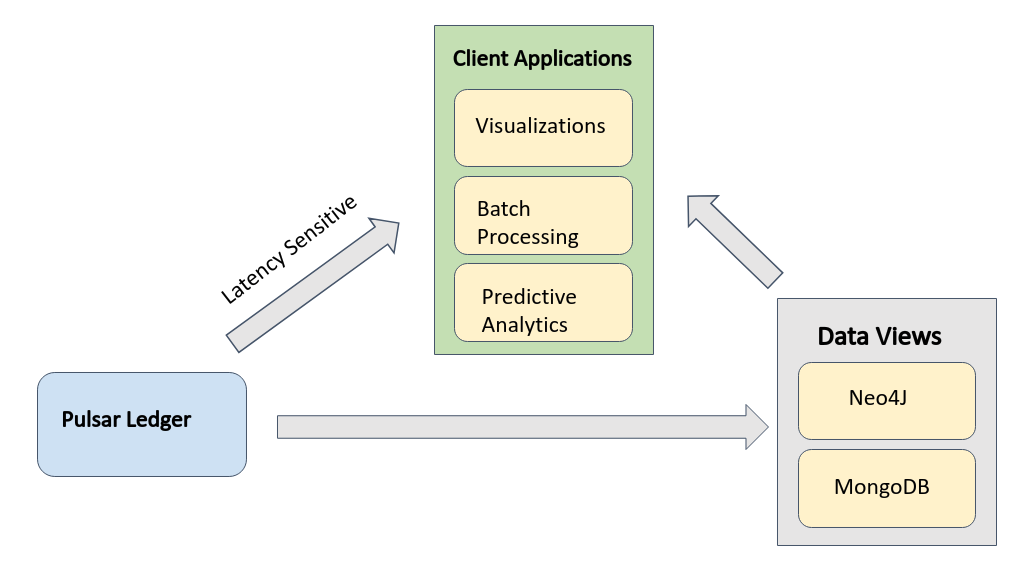
Fig 5: The global view of the proposed data architecture. The Pulsar Ledger provides a strongly consistent append only ledger of immutable facts from which all other systems are derived. The structured data views provide additional data structures and access APIs for non latency client applications while the distributed ledger provides real time access for latency sensitive applications.
5. Extensibility
The modular nature of our data storage system makes it highly extensible. New data stores such as SQL, Document based, specialized geospatial stores can be added and removed easily. Additionally, new data stores can quickly catch up to data by simply reading through the logs on the topics in which it subscribes to. This makes adding and removing new structures trivial. The same works for latency-sensitive client applications, which can attach directly to the distributed log or to structured data views that are optimized for various data schemas.
6. Current Data Store Status
The current status is as follows:
-
The Apache Pulsar system is implemented on six virtual machines at Vanderbilt. The data itself is distributed across three nodes (including one degree of redundancy per data source).
-
Two data sources are implemented (Neo4J and MongoDB) and are stored in ISIS (Vanderbilt) openstack.
-
Data sources implemented so far are:
-
The Viriciti data from the transit vehicles in Chattanooga from June 2019.
-
The real-time traffic data in Chattanooga at a frequency of one minute update from May-march 2019 and July 2019-August 2019
-
The high resolution elevation data for Chattanooga cross referenced with open street maps.
-
We are working on integrating the weather data
7. Analysis in Progress Using the Data
Data Curation (GPS Error Resolution and Elevation Data)
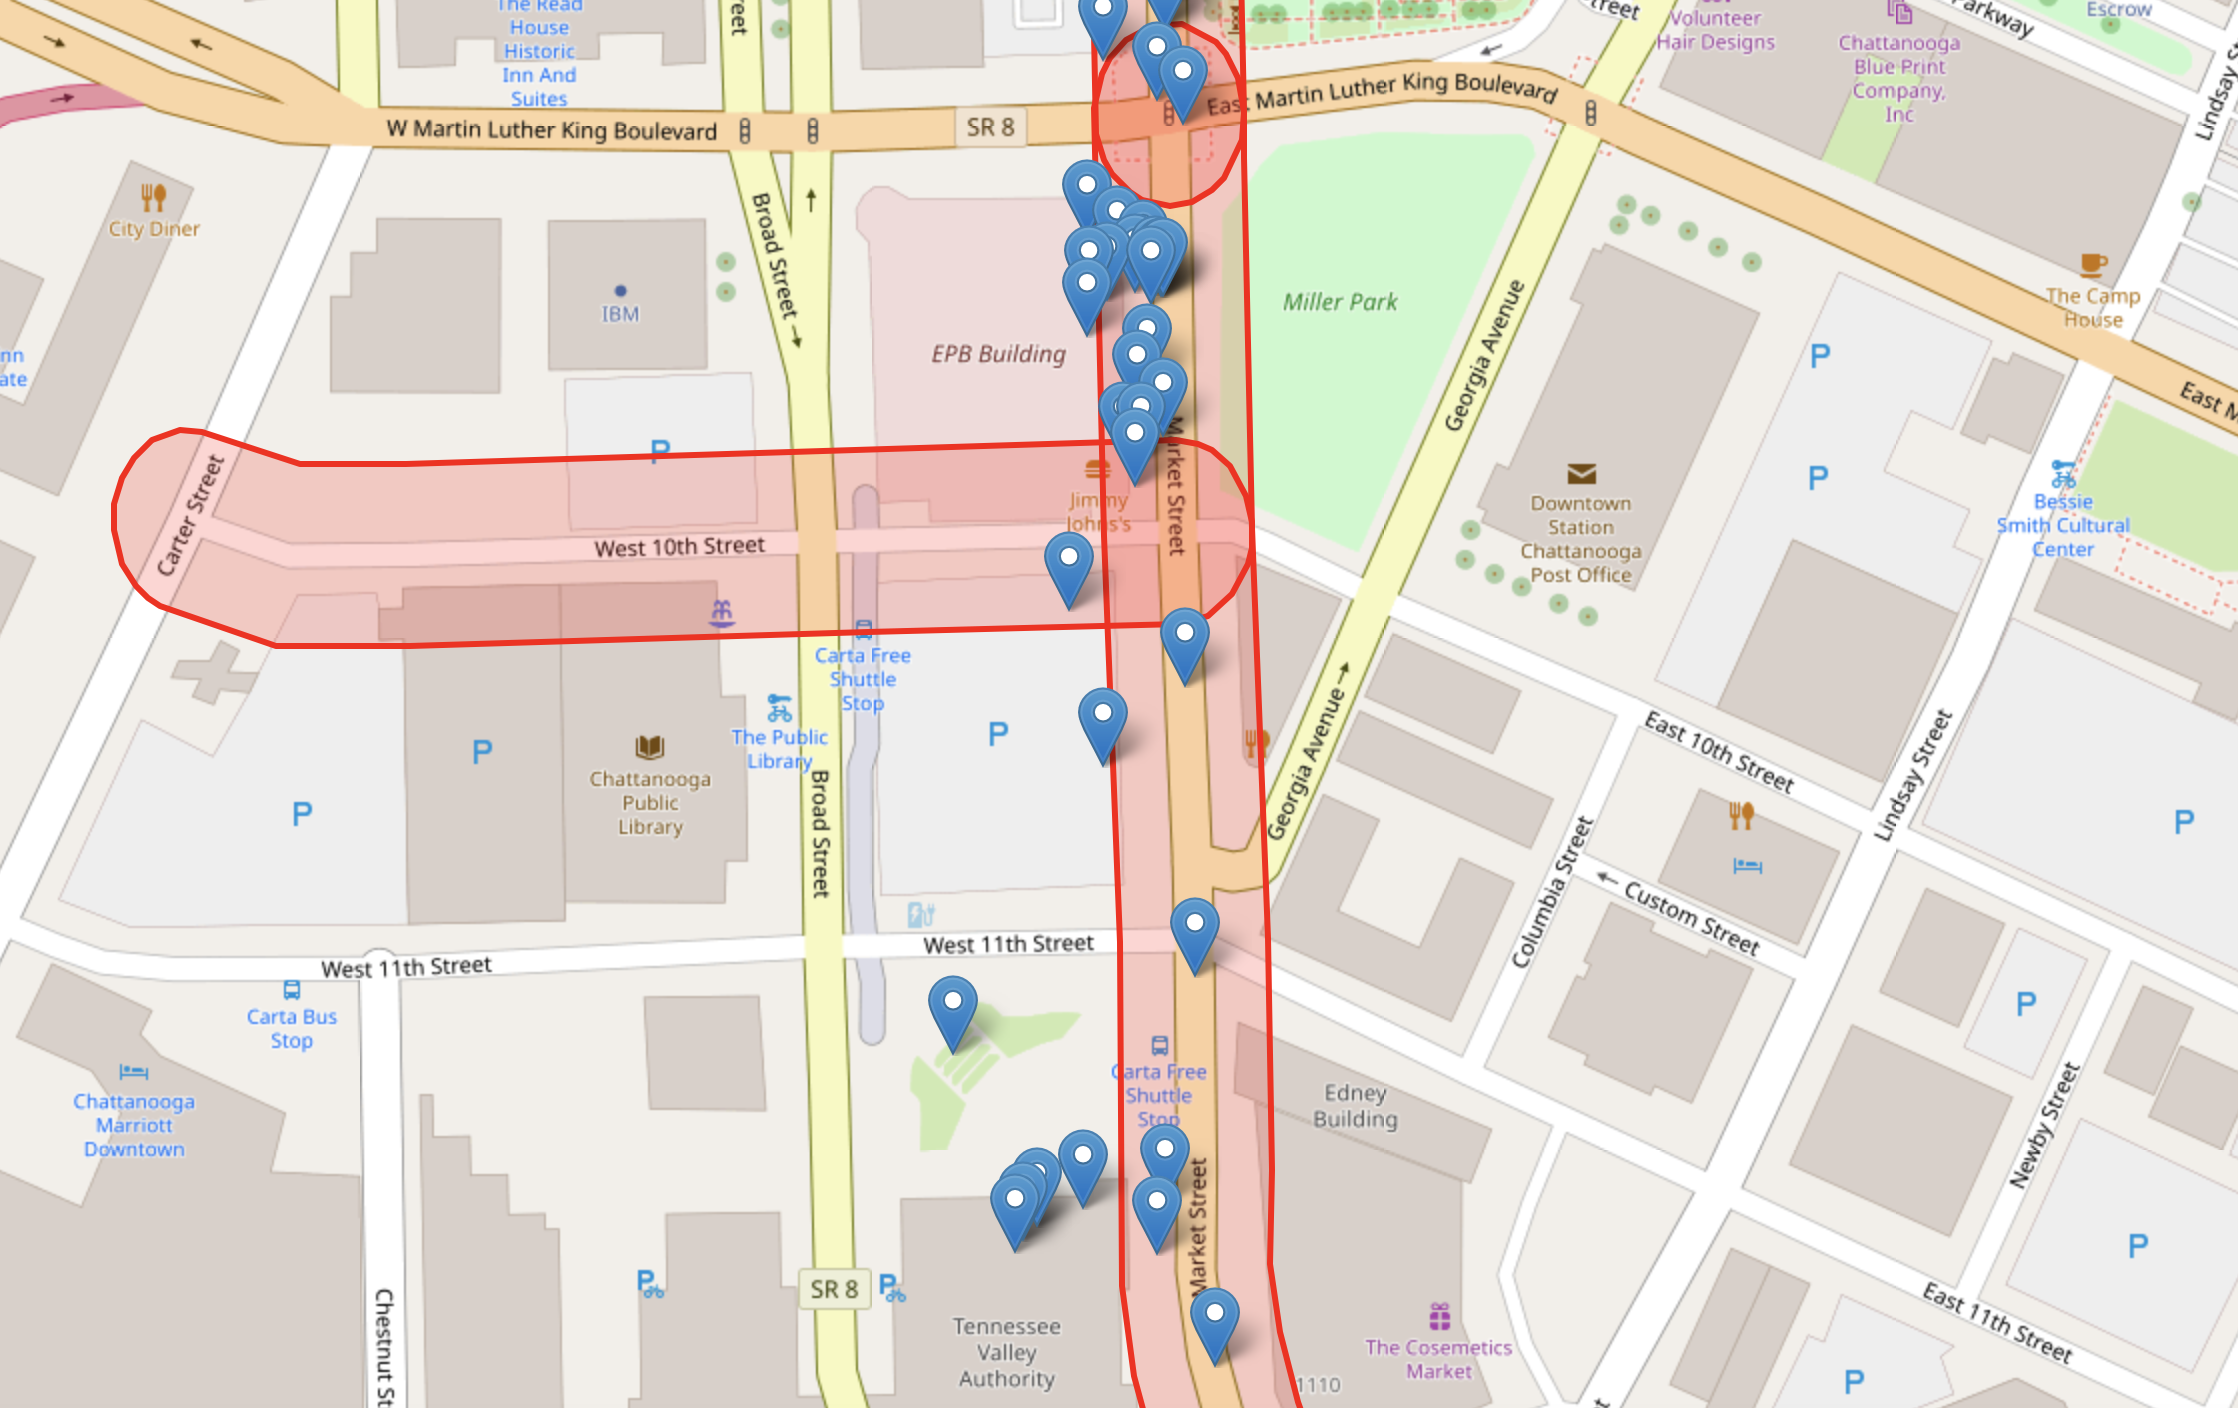
The vehicle location traces collected by ViriCiti using GPS are inherently noisy. Due to this noise, some of the recorded locations erroneously fall onto streets or parking lots that are adjacent to the streets where the vehicles actually travel. To map the noisy GPS coordinates to the correct streets, we combined the location traces with street-level maps obtained from OpenStreetMap (OSM) for the City of Chattanooga. For a particular GPS coordinate, we considered the list of nearby streets and compared them with the streets that are nearby prior and posterior coordinates from the location trace. We then mapped the GPS coordinate to a particular street based on both frequency and street types. The following figure shows the mapping of GPS coordinates to streets, where blue nodes represent the GPS coordinates from ViriCity, and red polygons represent the selected streets. Each separate polygon represents a distinct OSM road segment with a unique OSM identifier. For energy usage prediction, we combined the location traces with the correct street-level information, such as the type of the road, whether there is a tunnel or not, whether the road is two-way or one-way, etc.
To reliably predict fuel or energy consumption, we need to consider the elevation of the route on which the vehicle is travelling. When the bus travels uphill, it may consume more energy and time than when it travels downhill. So, we also combined the location traces and street-level data with accurate elevation data. We used OSM street-level maps for fetching the horizontal locations of streets, parking lots, etc., and an accurate topographic map to collect information about land elevation of feature.
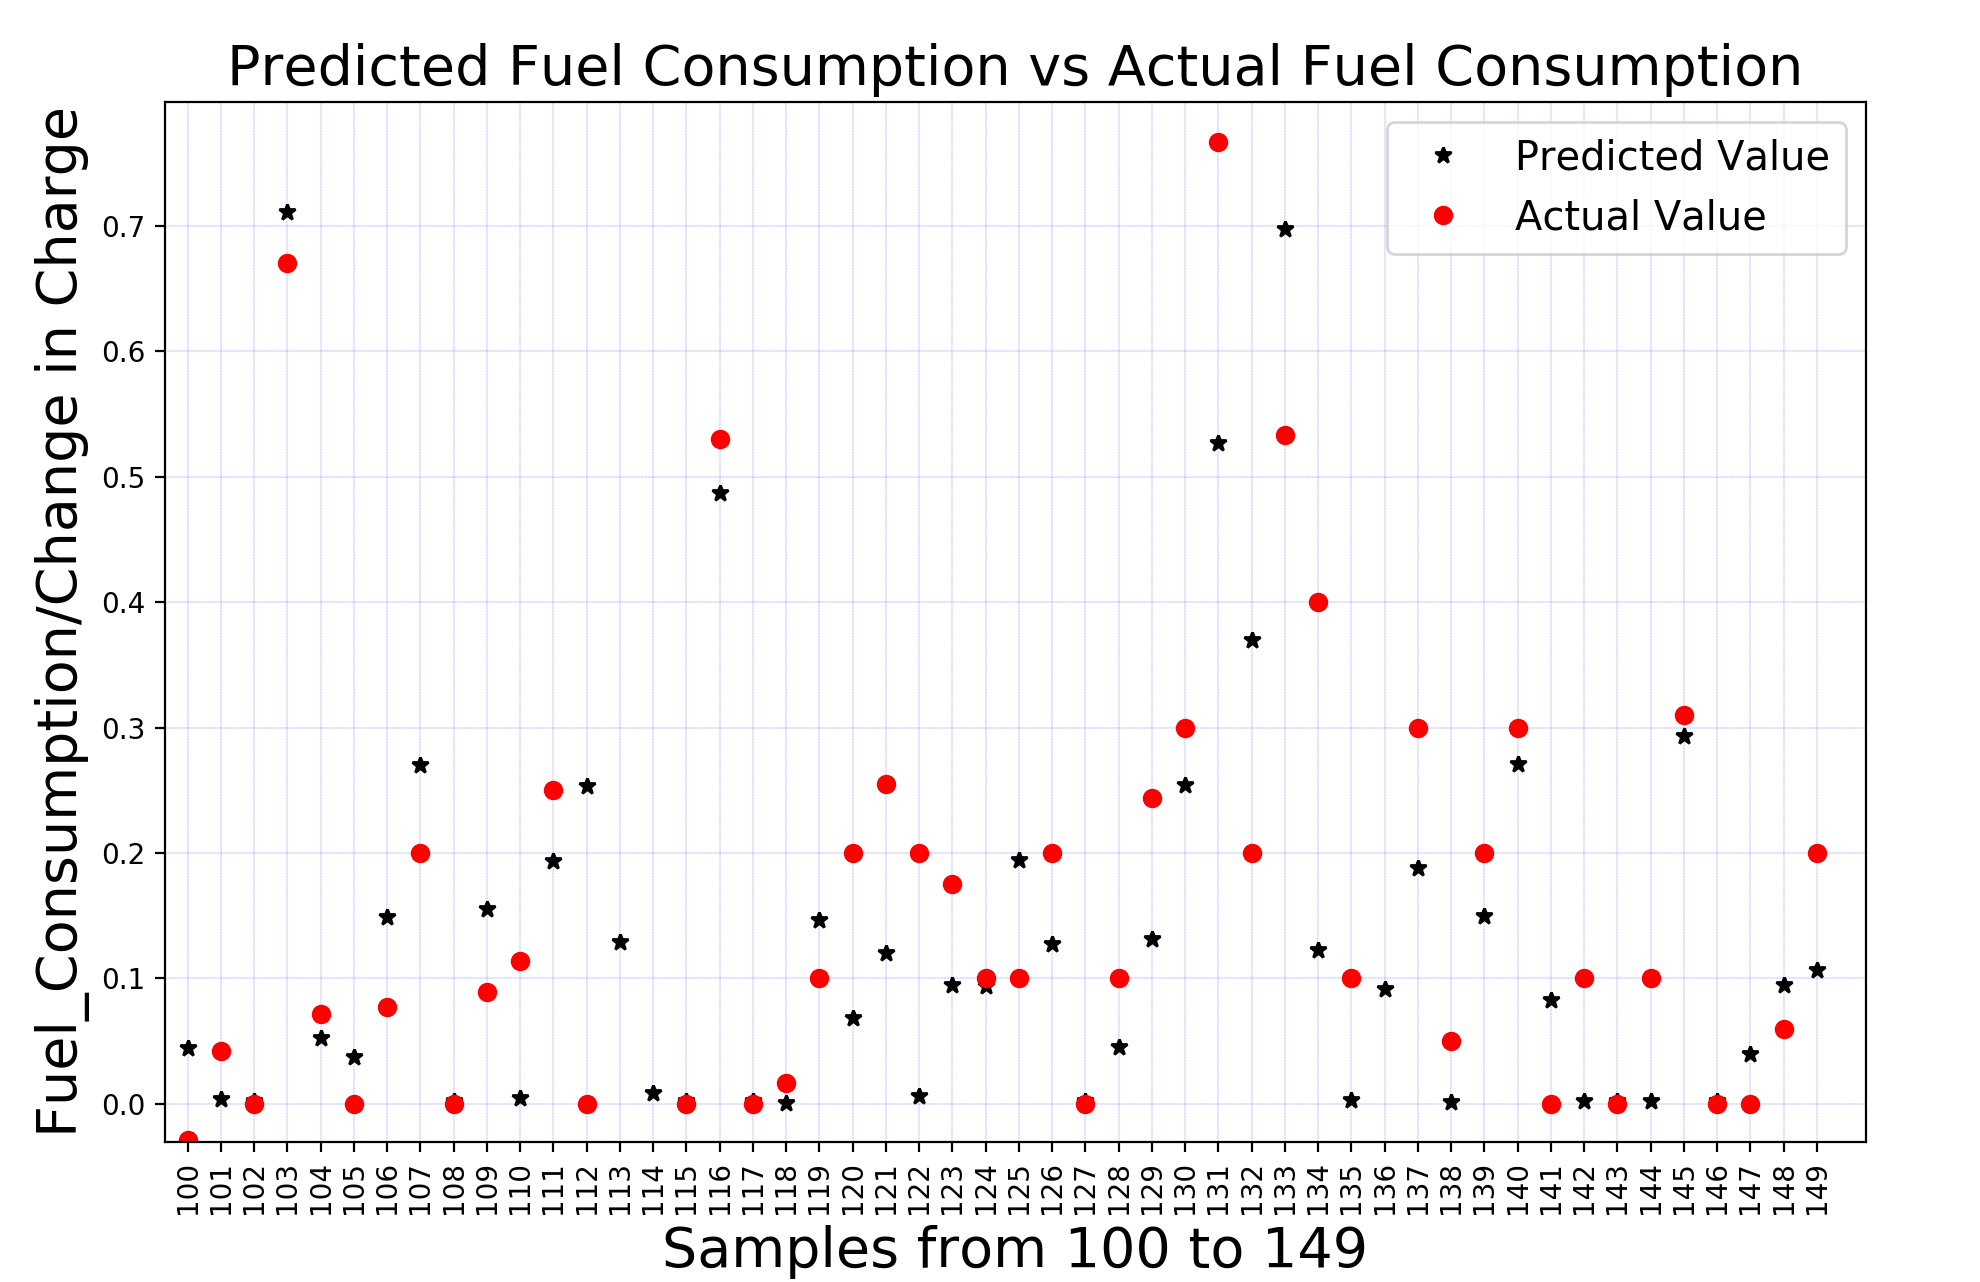
Generic Prediction Model for Energy Consumption
We used one month of data from ViriCity for an electric vehicle (BYD 752) and combined the GPS coordinates with street-level and elevation data. To prepare the data for training, we first segmented the location trace of the bus into disjoint samples. A sample is a continuous, maximal-length interval in which the bus travelled on a particular road (i.e., OSM road segment). We considered the distance between the first and last recorded GPS coordinates in the sample, the change in elevation, the type of road (includes different streets such as primary, trunk, service, residential etc.), etc. as the input features for prediction. We also took the first and last logged battery State of Charge for each sample, and considered the energy consumed to be the target feature for prediction.
We have tried three different approaches for our prediction model:
Linear Regression, Feed-Forward Neural Network, and Support Vector
Regression. Among these approaches, Feed-Forward Neural Network works
best with the lowest average mean squared error (0.072). The following
figure shows the predicted and actual values for 50 samples.
We are working on extending our model to consider hybrid vehicles as well.
Works Cited
[1] Chard, Kyle, et al. “Social Cloud Computing: A Vision for Socially Motivated Resource Sharing.” IEEE Transactions on Services Computing, vol. 5, no. 4, 2012, pp. 551–563., doi:10.1109/tsc.2011.39.
[2] Jiang, Zhe, and Shashi Shekhar. “Spatial and Spatiotemporal Big Data Science.” Spatial Big Data Science, 2017, pp. 15–44., doi:10.1007/978-3-319-60195-3_2.
[3] Pulsar 2.4.0 - Documentation. [http://pulsar.apache.org/docs/en/standalone/]{.ul}
[4] Merli, M. Ramasamy, K. “Why Apache Pulsar”. [https://streaml.io/blog/why-apache-pulsar]{.ul}
[5] Cheng, Bin, et al. "Building a big data platform for smart cities: Experience and lessons from santander." 2015 IEEE International Congress on Big Data. IEEE, 2015.
[6] Hashem, Ibrahim Abaker Targio, et al. "The role of big data in smart city." International Journal of Information Management36.5 (2016): 748-758.
[7] Kaur, Mankirat, Sarbjeet Singh, and Naveen Aggarwal. "Study of NoSQL Databases for Storing and Analyzing Traffic Data." Proceedings of 2nd International Conference on Communication, Computing and Networking. Springer, Singapore, 2019.
[8] Kreps J., “The Log: What every software engineer should know about real-time data's unifying abstraction”. [https://engineering.linkedin.com/distributed-systems/log-what-every-software-engineer-should-know-about-real-time-datas-unifying]{.ul}